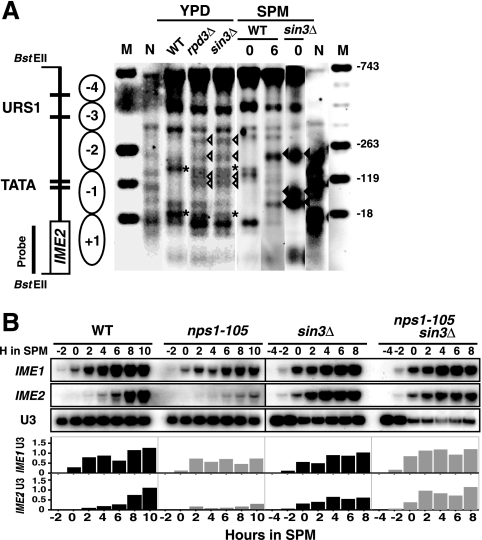
FIG. 5.
Effects of RPD3 and SIN3 deletions on the chromatin structure and the expression of the IME2 gene. (A) Nucleosome mapping by MNase digestion for the rpd3Δ (WHS20-D) and sin3Δ (WMY30-D) strains. Numbers indicate the time in hours (h) after the shift to SPM, and N denotes the naked DNA control. WT, wild type. Markers are as described in the legend to Fig. 1. (B) Northern blot analysis of IME1 and IME2 mRNA levels in the sin3Δ and nps1-105 sin3Δ cells. The strains used were wild type (W303-1D), nps1-105 (WTH-1D), sin3Δ (WMY30-D), and nps1-105 sin3Δ (WMY31-D). RNA samples were hybridized with radioactively labeled IME1 and IME2 probes. The U3 small nuclear RNA probe was used as a loading control. These experiments were performed three times with good consistency. Typical results are presented.

