FIG. 2.
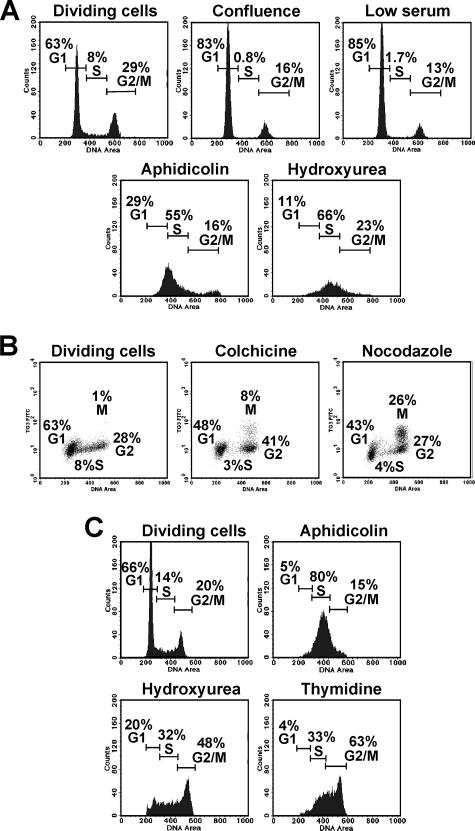
Analysis of cell cycle arrest. (A) Cell cycle distribution of IMR-90 normal human fibroblasts on day 3 after the indicated treatments. The number of cells is plotted against the DNA content determined by PI staining. (B) Analysis of M-stage arrest in IMR-90 cells treated as indicated. FITC fluorescence corresponding to cells stained with M-stage-specific antibody TG-3 is plotted against DNA content. (C) Cell cycle distribution of HeLa cells on day 2 after treatments. Twenty thousand cells were analyzed in each sample.

