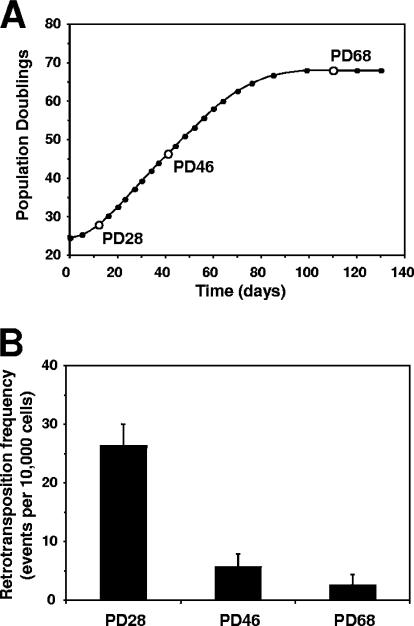
FIG. 6.
Inhibition of L1 retrotransposition during replicative senescence. (A) Growth curve for IMR-90 normal human fibroblasts. Open circles represent passages at which L1 retrotransposition was analyzed. (B) Retrotransposition frequency in IMR-90 cells of different replicative ages. The cells were transfected with an L1 retrotransposition cassette and analyzed by flow cytometry on day 5 after transfection. Retrotranspostion frequency was calculated as the ratio of GFP-positive cells obtained in transfection with L1 to GFP-positive cells obtained in transfection with pEGFP vector × 10,000 cells. All the experiments were repeated at least three times, and error bars represent standard deviations.

