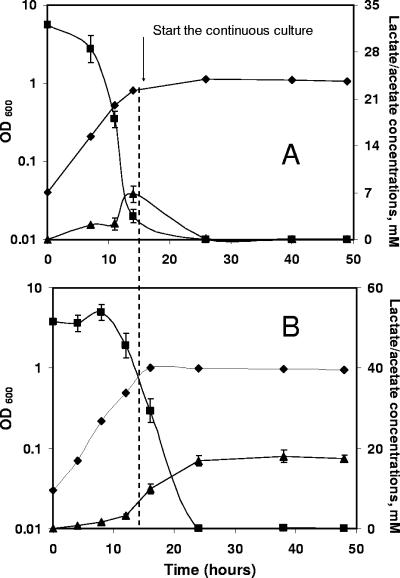
FIG. 2.
Time courses of biomass growth (♦), lactate concentration (▪), and acetate secretion (▴) in chemostat experiments under carbon-limited conditions (A) and oxygen-limited conditions (B). All data points have error bars representing the errors in the measurement; some error bars are not visible due to the very small measurement errors.

