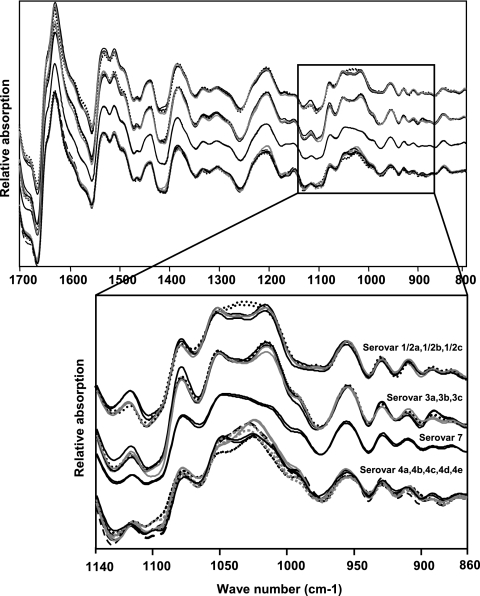
FIG. 1.
Typical first derivatives of infrared spectra of 12 Listeria monocytogenes serovars. Black dotted line, WSLC 1427, 1/2a; black solid line, WSLC 1030, 1/2b; gray solid line, WSLC 1377, 1/2c; black dotted line, WSLC 1485, 3a; black solid line, WSLC 1444, 3b; gray solid line, WSLC 11082, 3c; black dotted line, WSLC 1939, 4a; black solid line, WSLC 1634, 4b; gray solid line, WSLC 11094, 4c; gray dotted line, WSLC 1045, 4d; black dashed line, WSLC 1761, 4e; black solid line, WSLC 1932, 7. Each strain is represented by two independent spectra to show the reproducibility of the measurements. Spectra are stacked to clearly show the spectral differences among the four serogroups (1/2, 3, 7, and 4). The polysaccharide region (1,200 to 900 cm−1) has been expanded to show the subtle differences between and within the serogroups. WSLC, Weihenstephan Listeria Collection.

