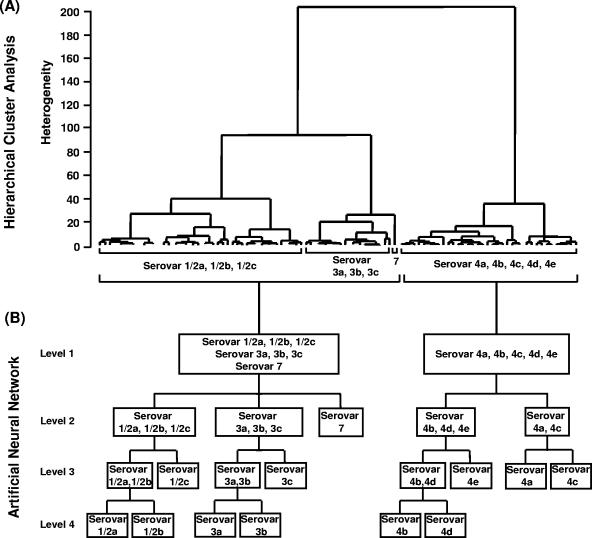
FIG. 2.
(A) Hierarchical cluster analysis of the first derivatives of 106 L. monocytogenes strains belonging to 12 serovars and included in the reference data set. Spectral regions used were 900 to 1,200 cm−1 and 1,400 to 1,800 cm−1 (correlation with scaling to first range according to the OPUS FT-IR program [Bruker, Ettlingen, Germany]). Cluster analysis was performed using Ward's algorithm. (B) Artificial neural network classification scheme for the discrimination of serogroups and serovars.

