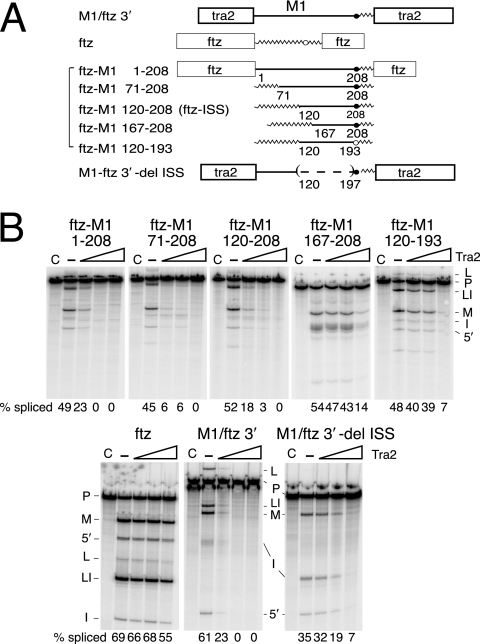
FIG. 1.
Mapping the intronic splicing silencer. (A) A schematic of the transcripts that were used in the in vitro splicing assays. The boxes indicate exons from the tra2 or ftz gene as labeled. The straight lines indicate M1 intron sequences, and jagged lines indicate intron sequences from the ftz gene. The positions of endpoints for M1 intron sequences are indicated as the number of nucleotides from the M1 5′ splice site. Branch point sequences deriving from the M1 intron (solid circle) and ftz intron (open circle) are indicated. The parentheses and the dashed line indicate deleted sequences. (B) A set of five in vitro splicing reactions is shown for each transcript. Lanes C are control reactions with no ATP; —, reactions supplemented with ATP but not recombinant Tra2 protein. Lanes under the triangles are reactions supplemented with increasing amounts of recombinant Tra2 protein. Products from in vitro splicing reactions are indicated to the side of each gel, including pre-mRNA (P), mRNA (M), lariat intermediate (L), lariat intron (LI), 5′ exon (5′), and linear intron (I). The total percentage of splicing products and intermediates is given below each gel lane (% splicing).

