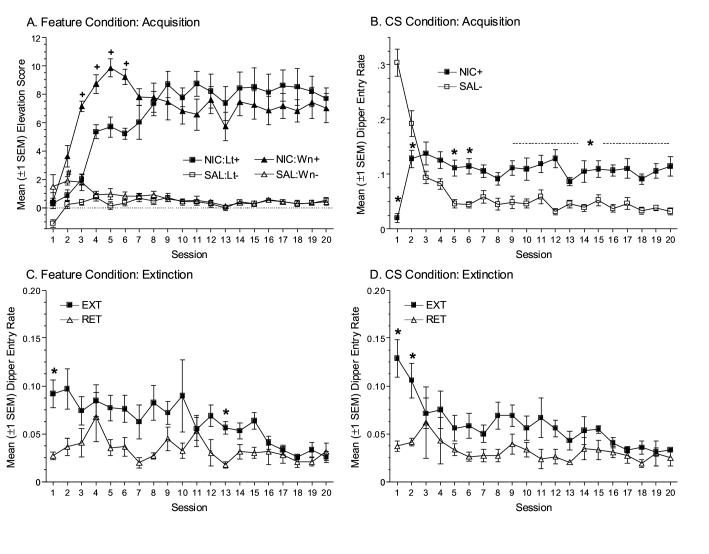
Figure 1.
(A) Mean elevation scores (±1 SEM) from discrimination training for rats in the Feature condition receiving the light or white noise target CS. (B) Mean dipper entry rates (±1 SEM) from discrimination training for rats in the CS condition. Mean dipper entry rates for EXT and RET groups during the drug extinction phase for rats in the Feature (C) and CS (D) conditions, respectively. + indicates elevation score for rats receiving the white noise CS differs significantly from rats receiving the light CS in the nicotine state, p<0.05. # indicates elevation score for rats receiving the white noise CS differs significantly from rats receiving the light CS in the saline state, p<0.05. * indicates dipper entry rate on drug session significantly differs from responding on corresponding saline session (B), or dipper entry for EXT group significantly differs from RET group (C & D), p<0.05.

