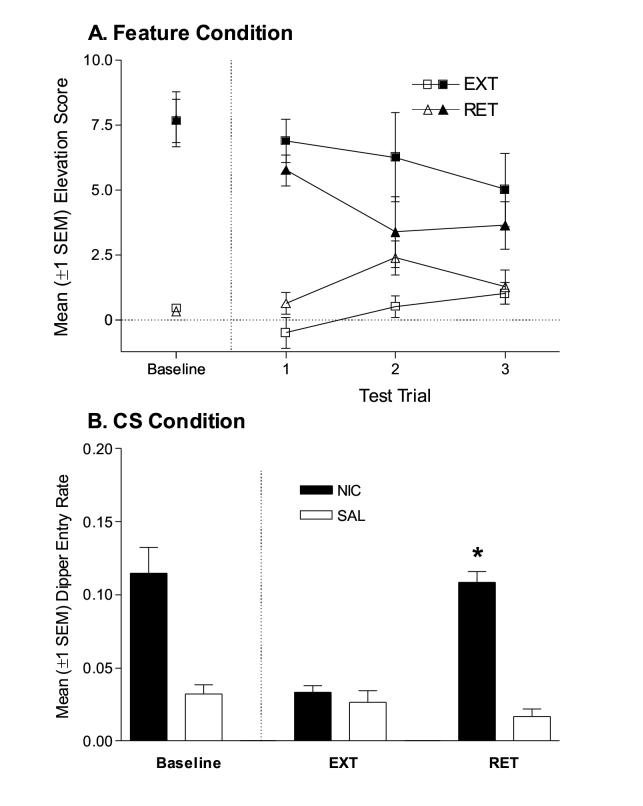
Figure 2.
(A) Mean elevation scores (±1 SEM) from the post-extinction test for rats in the Feature condition. For comparative purposes, baselines are included in the left-hand portion of the graph. These data points represent mean elevation scores from the first trial of the last nicotine and saline sessions for each group from Discrimination Training. Filled symbols represent elevation scores from nicotine trials, open symbols represent elevation scores from saline test trials. (B) Mean dipper entry rates (±1 SEM) from the post-extinction test for rats in the CS condition. Baselines are included in the left-hand portion of the graph; these data points represent means for each measure from the last nicotine and saline sessions of Discrimination Training. * indicates dipper entry rate on drug session differed significantly from dipper entry rate on saline session, p<0.05.

