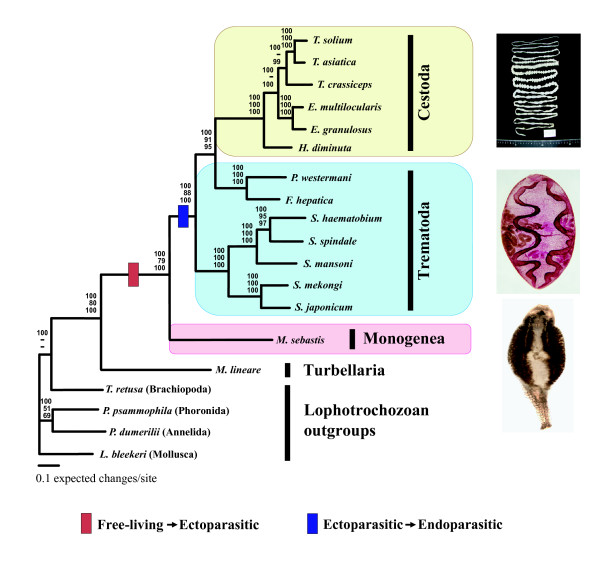
Figure 2.

Phylogenetic relationships among the neodermatan groups based on the analysis of amino acid sequence data from 12 mitochondrial protein-coding gene loci using the Bayesian analysis, maximum likelihood, and maximum parsimony methods. Numbers above the branches represent Bayesian posterior probabilities, quartet puzzling supporting values, and parsimony bootstrap values, respectively. The branches that were not universally supported with values of ≤ 50% are represented by "-" in each supporting values of the node.
