
Figure 3.
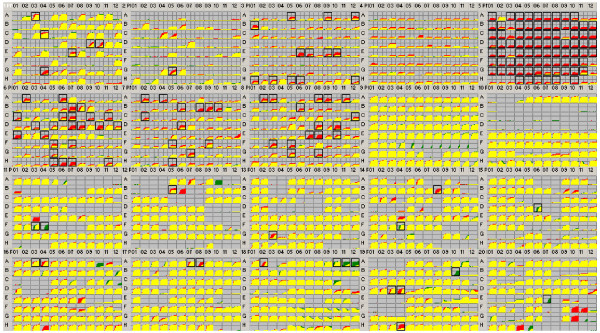
PM comparative analysis of RN6390 WT and hfq strains. The WT and the hfq mutant were subject to PM analysis of ~ 2000 phenotypes. Incubation and time course curves for respiration (tetrazolium color formation) in specific conditions were generated with Omnilog-PM software (see for more details [42]). The PM kinetics shows consensus data comparing the RN6390 hfq mutant (green) to its respective WT strain (red). Red indicates a stronger response by the parental strain and green indicates a stronger response by the hfq mutant. When the two strains have equivalent metabolism or sensitivity to a stress or chemical agent, the red and green kinetic graphs overlap and are yellow. Boxes surrounding a specific condition indicate a significant difference in response. Values of gain or loss of phenotypes are in Table 1 of supplementary data.