
Figure 1.
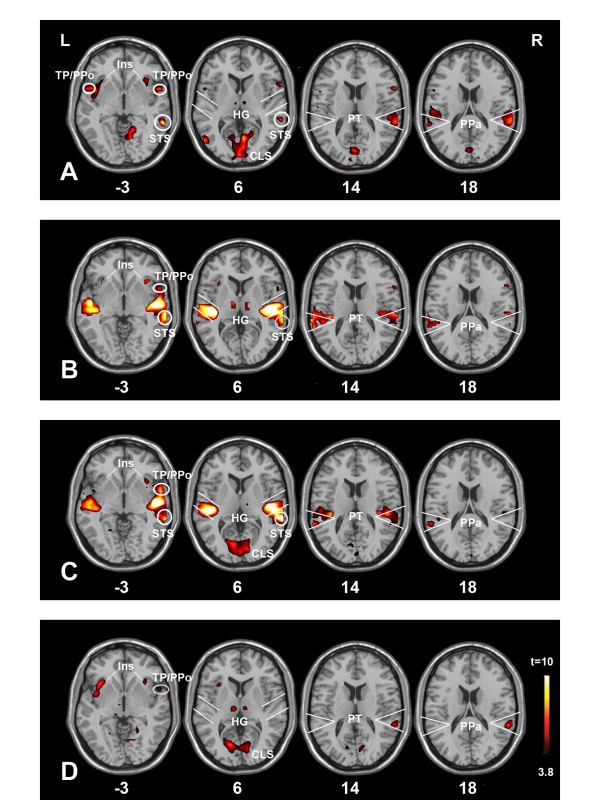
Functional brain responses collected during the four experimental phases are depicted. The brain scans show consistently stronger functional activation for stimuli conditions relative to silent control obtained from the second out three volumes. All functional contrasts are thresholded at T = 3.79, p ≤ 0.001 (uncorrected α-level, k ≥ 10) and superimposed on transverse and sagittal slices of the MNI-T1-weighted standard brain. Tables 1-4 list peak activations (T-values) of distinct activation clusters and anatomical areas. [A] Visual habituation, [B] Auditory habituation, [C] Conditioning phase, [D] Test phase (extinction).