
Figure 2.
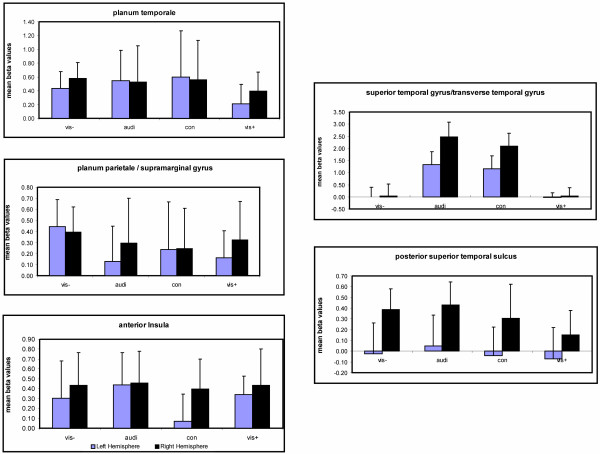
Results of spherical ROI analysis. Mean β-values collected from five bilateral distinct regions in the fronto-temporo-parietal cortex. Error bars refer to the standard deviation.
Official websites use .gov
A
.gov website belongs to an official
government organization in the United States.
Secure .gov websites use HTTPS
A lock (
) or https:// means you've safely
connected to the .gov website. Share sensitive
information only on official, secure websites.
Results of spherical ROI analysis. Mean β-values collected from five bilateral distinct regions in the fronto-temporo-parietal cortex. Error bars refer to the standard deviation.