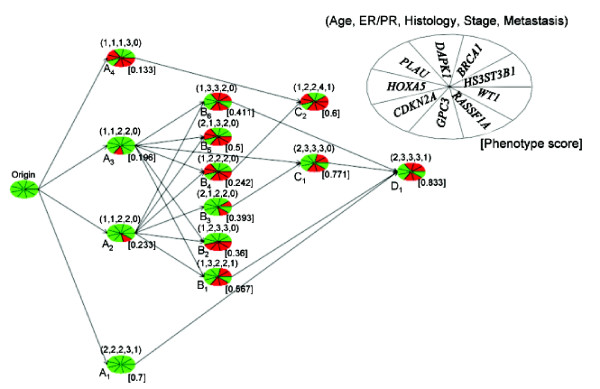
Figure 1.
Progression pathway network with w = 0.8, ε = 0.8 and the LH algorithm. The methylation data analyzed here are from 86 primary breast cancers. A set of 9 gene promoter CpG islands is investigated. The methylation statuses of the genes in each node are represented in a color-coded pie chart, with red signifying hypermethylation while green denoting lack of differential methylation. There are five phenotype measurements for each tumor. They are: age (1, age > 55; 2, age ≤ 55), ER/PR (1, +/+; 2, +/- or -/+; 3, -/-), histology (1, well-differentiated; 2, moderately-differentiated; 3, poorly-differentiated), clinical stage (1, 2, 3, or 4), and metastasis status (0, M0; 1, M1). The phenotype center for each phenotype is listed above each node in the order described above. The pathway network presented here conforms to strict heritability and tumor phenotype progression.

