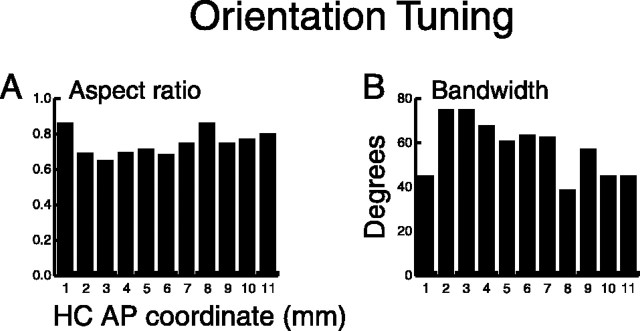
Figure 11.
Distribution of aspect ratio and bandwidth along the AP axis. A, Mean aspect ratio of tuned neurons. The aspect ratio [(preferred orientation rate-worst orientation rate)/preferred orientation rate] was calculated for each tuned pad and then averaged across all tuned pads of each neuron. B, Mean bandwidth of tuned neurons. Bandwidth (width at half peak of the tuning function) was calculated for each tuned pad and then averaged across all tuned pads of each neuron.

