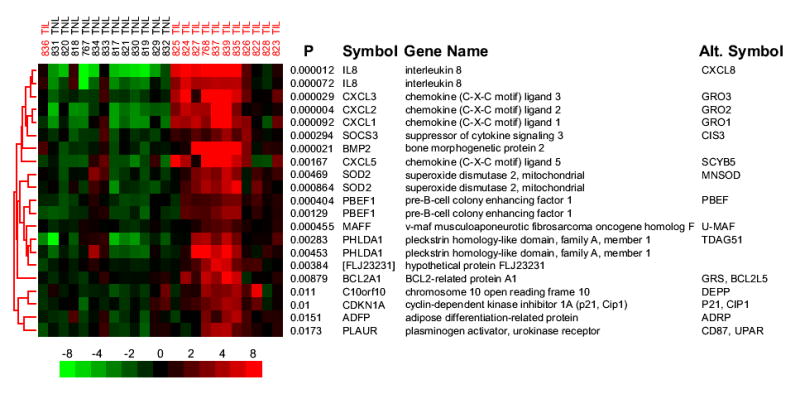
Figure 2. Subcluster of discriminant probe sets with the lowest P values.

A sub-cluster of probe sets taken from the hierarchical clustering shows genes previously implicated in parturition and genes involved in the acute inflammatory response. Row labels correspond to the permuted t-test P value followed by the HUGO Gene Nomenclature Committee (HGNC) official gene symbol and include the most commonly used alternative gene symbol. The color scale and column labels follow the same conventions as Figure 1.
