Fig. 2.

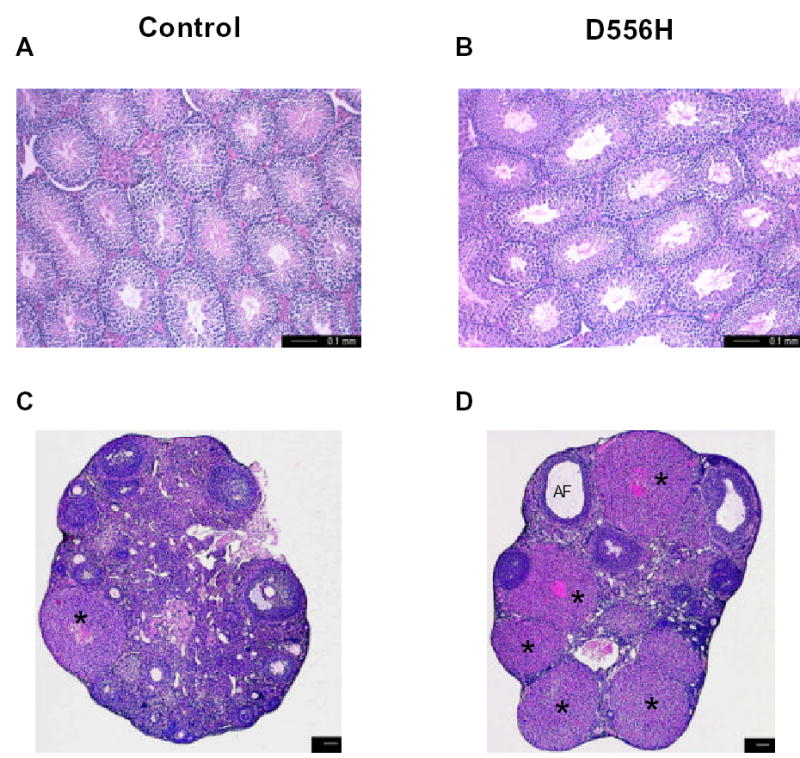
Photomicrographs of testicular and ovarian sections of control (A and C, respectively) and D556H founder (B and D) mice at 8 months of age. *, corpus luteum, AF, degenerating follicles. Scale bars represent 100 μm (C, D).

Photomicrographs of testicular and ovarian sections of control (A and C, respectively) and D556H founder (B and D) mice at 8 months of age. *, corpus luteum, AF, degenerating follicles. Scale bars represent 100 μm (C, D).