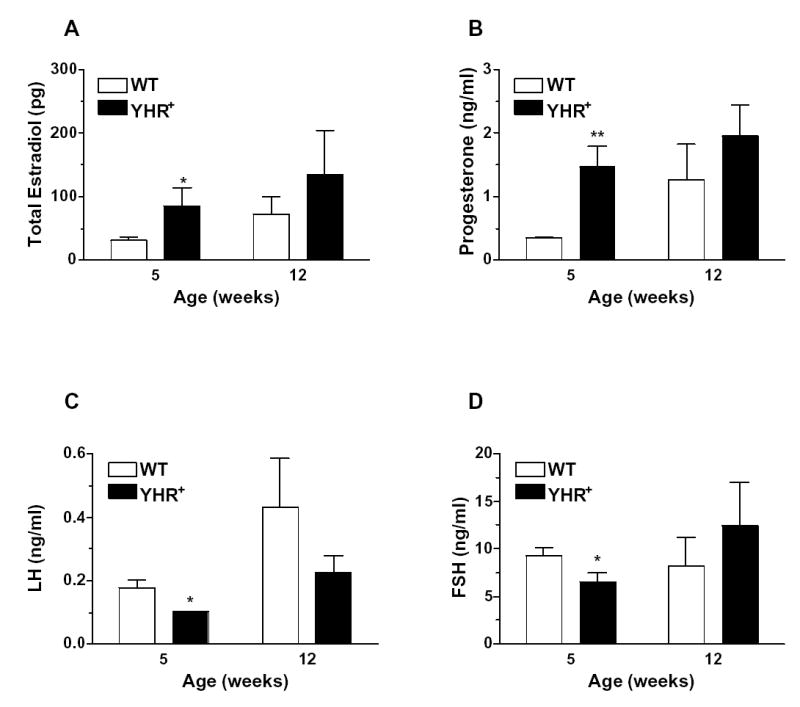
Fig. 3.

Hormonal profile of female YHR+ transgenic mice at prepubertal and adult ages. (A) Estradiol levels were measured in ovarian extracts and the data represent amount of hormone from both ovaries. (B, C and D) serum progesterone, LH and FSH respectively. Data are presented as mean ± SEM. n=5–8. * P<0.05, **P < 0.01 compared to WT.
