
Figure 8.
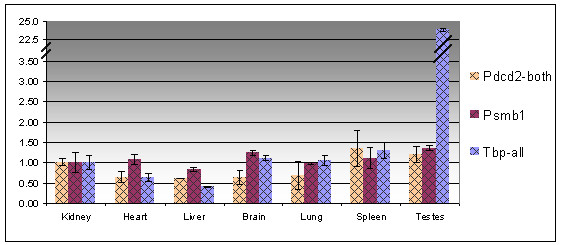
Quantification of the expression of Pdcd2, Tbp and Psmb1 transcripts in different mouse tissues. For better visualization of the results, the relative quantity in kidney was taken as one.
Official websites use .gov
A
.gov website belongs to an official
government organization in the United States.
Secure .gov websites use HTTPS
A lock (
) or https:// means you've safely
connected to the .gov website. Share sensitive
information only on official, secure websites.
Quantification of the expression of Pdcd2, Tbp and Psmb1 transcripts in different mouse tissues. For better visualization of the results, the relative quantity in kidney was taken as one.