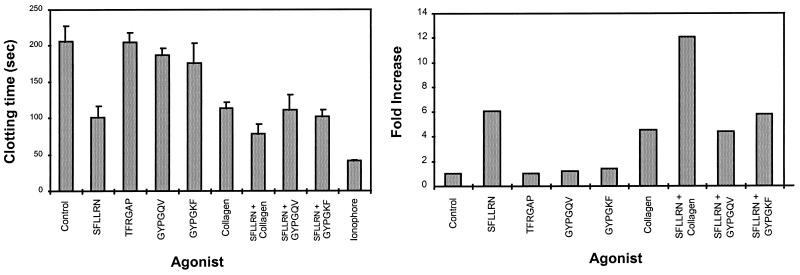
Figure 4.
(Left) Clot formation in the presence of platelets activated with various agonists. Concentrations of agonists: SFLLRN, 100 μM; TFRGAP, 500 μM, GYPGQV, 1000 μM; GYPGKF, 500 μM; collagen, 20 mg/ml; Ca ionophore A23187, 5 μM. TFRGAP, which did not lower the clotting time, was used as a negative hexapeptide control. The data shown are the results from independent experiments, using platelets adjusted to 300,000 per μl. (Right) The fold increase in clot acceleration was calculated by using an activated platelet standard curve which plots clotting time as a function of platelet dilution in a double logarithmic plot.

