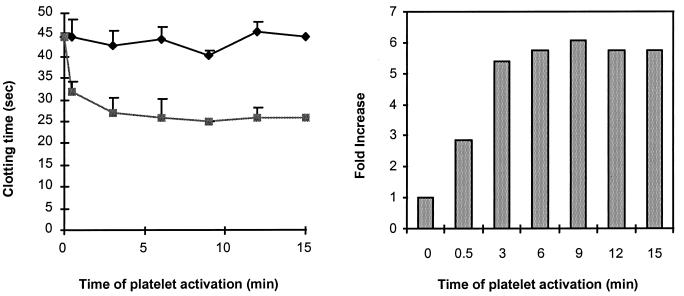
Figure 5.
(Left) Time curve for the activation of platelets by SFLLRN. A final concentration of 200 μM SFLLRN was used to activate platelets, and aliquots were examined for clot acceleration in a clotting assay initiated by the addition of 10 nM VIIa and soluble tissue factor and 10 mM calcium chloride. ⧫, No agonist; ■, activation with SFLLRN. (Right) The fold increase in clot acceleration was calculated by using an activated platelet standard curve, which plots clotting time as a function of platelet dilution in a double-logarithmic plot.

