
Figure 2.
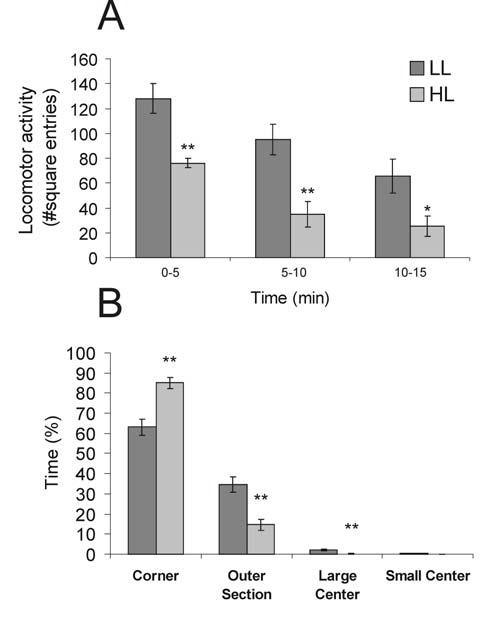
Graphs illustrating the effects of open-field exposure in low-light (LL: 8-13 lux) or high-light (HL: 400-500 lux) conditions on behavior (mean + SEM), including A) locomotor activity, scored as the number of square entries during each five min block of the 15 min open-field test, *p < 0.05, **p < 0.01 versus LL group; post hoc Bonferroni pairwise comparisons, and B) percentage of time spent in each square type, **p < 0.01; Student's t-test for independent samples.