Figure 1.
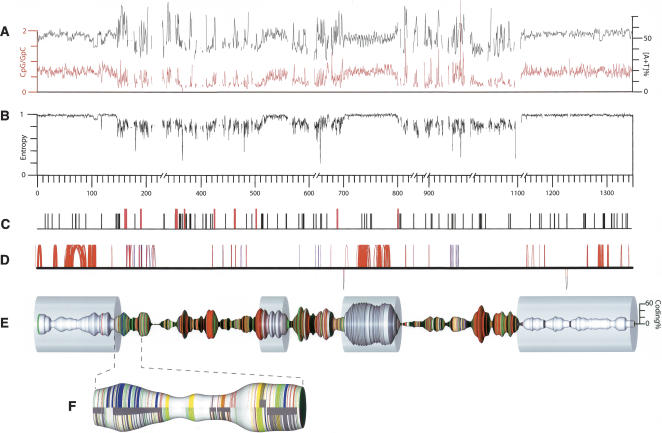
E. tenella chromosome 1. (A) The [A+T] content of the sequence (black; 1-kb sliding window) and the ratio of CpG to GpC dinucleotides (red; 1-kb sliding window). (B) The information content (second-order Markov entropy) of the sequence, in a 1-kb sliding window. Values are normalized such that fully repetitive sequence has an information content of 0, and random sequence has an information content of 1. (C) The locations of TGCATGCA motifs (black vertical ticks) or longer [TGCA] tandem repeats (red). (D) Perfect segmental duplications of >50 bp in length along the chromosome (represented by the solid horizontal line); hoops above the line link sequences are duplicated in the same orientation; those below the link are inverted duplications. The color of the hoops indicates the proportion of simple tandem repeats in the duplicated element—(blue) more repetitive, (red) less repetitive; duplicates involving only simple tandem repetitive sequence are not shown. Note that many duplications have only a very short intervening sequence and hence appear as vertical lines. (E) Chromosome 1 with the thickness of the spindle corresponding to the coding density (proportion of nucleotides encoding amino acids; 20-kb center-weighted sliding window; scale at right). Colored bands indicate CAG repeats (red), telomere-like AGGGTTT repeats (green), other simple-sequence repeats (yellow), LINE-related sequences (blue), and gaps (black). The transparent cylinders indicate the feature-poor (P) segments. Physical gaps that are represented as >10 kb in the assembly (and in the corresponding GenBank record) have been condensed to 10 kb in this representation; the distance scale is broken to reflect this. (F) A representative section of a feature-rich (R) segment expanded to show the arrangement of repeat elements (color coding as for panel B) and genes (dark gray; solid segments near the center line indicate complete genes, and narrower wrap-around bands indicate the individual exons). Features are depicted separately for the forward strand (upper) and reverse strand (lower).

