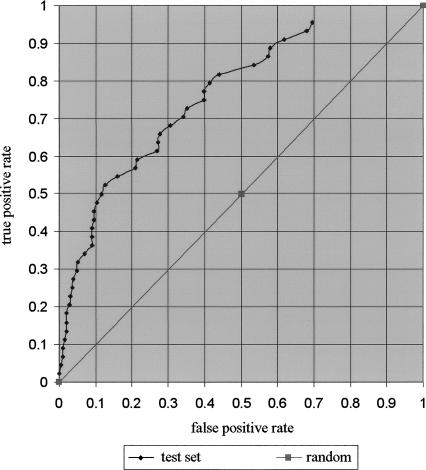
Figure 2.
ROC curves of muscle gene prediction. Genomic genes are ranked by their muscle-specificity score. We plotted the ROC curves of the set of well-characterized muscle-specific genes that were not used for motif identification (44 test set). The diagonal line represents the result of random guessing. The Y-axis is the fraction of true positives exceeding the cutoff for every cutoff value. The X-axis is the fraction of true negatives that exceed the same cutoff.

