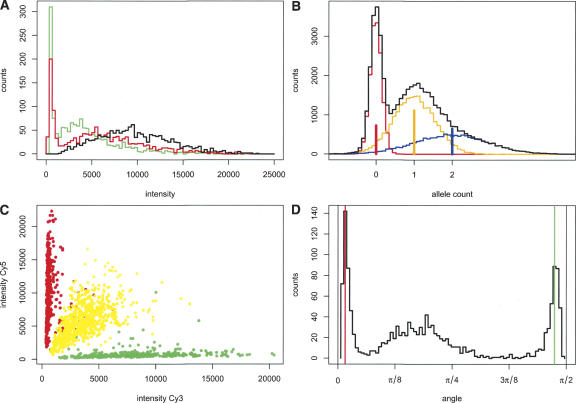
Figure 1.
Exploration of BeadArray signal properties. (A) Example of the distributions of the green (Cy3) and red (Cy5) fluorescent signals from a normal sample. The combined intensity (sum of both alleles of a probe) is shown in black. Note that the combined signal is not simply the addition of both signals because of the reciprocal relationship between the alleles. (B) Simulation of the distribution of single channel signal intensities derived from SNPs with zero (red), one (orange), and two (blue) copies of an allele. The frequency for each allele type was taken from the red signal of panel A. The separate distributions were modeled as Gaussian distributions with mean = copy number and SD = copy number × 0.4 + 0.15. The black line indicates the combined signal distribution plot. (C) Scatter plot of raw intensities for homozygous (red and green) and heterozygous (yellow) SNPs. (D) Histogram of raw intensities in polar coordinates. The red line indicates the most prevalent angle for homozygous Cy5-labeled SNPs; the green line, homozygous Cy3-labeled SNPs.

