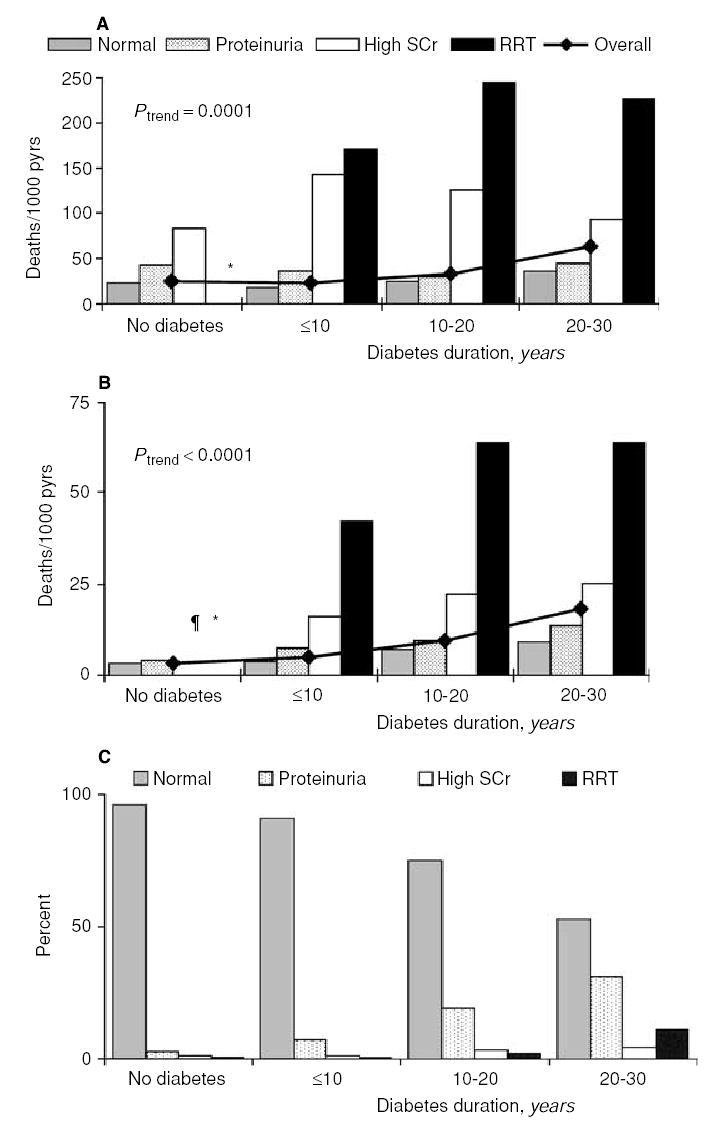
Fig. 1. Trends in age- and sex-adjusted death rates from natural causes (A) and cardiovascular disease (CVD) (B).

The bars represent mortality rates stratified by diabetes and its duration in the 4 kidney function categories. The line shows overall death rates by diabetes and its duration. Overall mortality rates were positively associated with duration of diabetes and were similar in the nondiabetic subjects and those with diabetes of <10 years’ duration. Panel (C) is a frequency distribution of person-years stratified by diabetes and its duration in the 4 kidney function categories. The fraction of person-years of follow-up among persons with normal kidney function ranged from 96% in nondiabetic subjects to 53% in those with 20 to 30 years of diabetes. Conversely, the fraction of person-years among persons on renal replacement therapy (RRT) ranged from 0.4% in nondiabetic subjects to 12% in those with 20 to 30 years of diabetes. ¶ Rate is null; *insufficient data.
