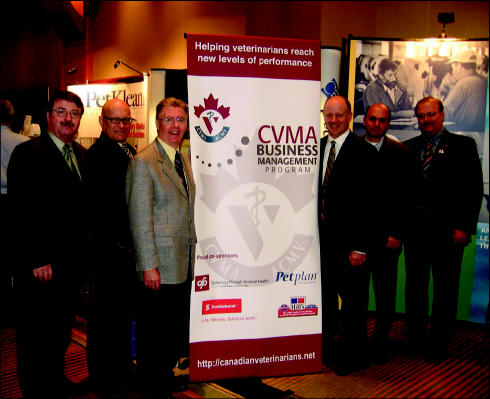
Business Management Program sponsors from the left: Dr. Frank Richardson, chair, CVMA Business Management Committee; Mr. John Jamieson, Scotiabank; Dr. Clayton MacKay, Hill’s Pet Nutrition Canada Inc.; Mr. Randy Valpy, Petplan Insurance; Mr. Paul Ray, Schering-Plough Animal Health; and, Dr. Paul Boutet, CVMA President.
Dollar for dollar, the provinces with the highest veterinary fees in Canada are the conspicuous ones — Alberta with its oil-fueled hyperinflation, and Ontario with its long history of economic research and fee guides. However, most provinces have similar fees after adjustments have been made for differences in cost of living. In 4 of the 7 provinces studied, the cost of living adjusted companion animal fees differed by only 1%.
Information for this article is from the 2006 CVMA provincial economic surveys. Provincial surveys were undertaken through the joint partnerships of the CVMA Business Management Program, individual provinces, and the following corporate sponsors: Hill’s Pet Nutrition Canada, Petplan Insurance, Scotiabank, and Schering-Plough Animal Health.
The comparison of fees includes all provinces, except Manitoba, New Brunswick, and Newfoundland. Provincial economic surveys are currently underway in these provinces and future articles will include their data. There were 604 hospitals that responded to their provincial survey for an average provincial response rate of 35%. The figures in this report are generally accurate to +/− 4.6%, 19 times out of 20.
Hospital fee guides are comprised of hundreds of individual procedure fees. Consequently, it is impossible to gauge the level of fees for a hospital or group of hospitals by examining the fee guide in its entirety. However, to simplify fee comparison, a representative sample of 23 companion animal procedures and markups was used to gauge the overall level of companion animal fees. Collectively, these fees represent more than 75% of practice revenue in companion animal hospitals. To further simplify comparison, a single Companion Animal Fee Index was developed, using a weighted average of the 23 fees and their relative importance to practice revenue. Procedures that were done more often in practice contributed more to the index.
Bovine and equine fee indices were constructed by using a weighted average of commonly used professional fees. Markups on medications were not included in the fee indices.
To ease comparison of the indices, a base of 100 was set as the national average for 2006. If the fee index in a province was higher than 100, then the 2006 level of fees for that province would be higher than the national average for 2006. Conversely, if the fee index was lower than 100, the fees in that province would be lower than the national average. For example, the province with the highest Companion Animal Fee Index was Ontario with an index of 122. This index shows that the average level of companion animal fees was 22% higher than the national average. The province with the second highest fees was Alberta with a Companion Animal Fee Index of 114. Average fees in Alberta were 14% above the national average in 2006. The differences in provincial companion animal fees varied greatly in 2006; from the highest in Ontario, to lowest in Prince Edward Island. The difference in average companion animal fees was 52%.
All provinces use the same currency, but a dollar goes a lot farther in some provinces than in others. Inflation and input costs are lower in some provinces and, as a result, the cost of living (for pet owners) is different from province to province. To measure differences in cost of living in the provinces, an adjustment was made based on average family expenditure in each province (1). The cost of living adjustment levels out the importance of veterinary expenditures in each of the provinces. For example, the average family in Ontario spends much more each year than the average family in Prince Edward Island. Because more is spent in Ontario, the relative importance of 1 dollar spent on veterinary medicine is lower in Ontario than in Prince Edward Island.
After the cost of living adjustment has been made, the ranking changes dramatically. Ontario falls from having the highest fees to 3rd place after Nova Scotia and Alberta. Before having made any cost of living adjustments, the companion animal fees in Nova Scotia were 1% above the national average. After the cost of living was taken into account, companion animal fees in Nova Scotia soared to 20% above the adjusted national average.
Companion animal fees may also be adjusted by the cost of living in major provincial cities. This adjustment is done to compare the importance of companion animal fees in the urban centers around the country. After fees have been adjusted by using an Urban Cost of Living adjustment, most of the differences disappear. The province with the lowest urban companion animal fees is still Prince Edward Island, but it is only 10% below the national average. There is very little difference in the relative importance of companion animal fees in most cities across Canada. In fact, the province with the highest Urban Cost of Living Adjusted Fee Index (1% above the national average) is Saskatchewan.
Unfortunately, Saskatchewan quickly falls to the bottom when bovine fees are compared. When provinces that do not have subsidy programs for large animal practices are compared, the province with the highest bovine fees is British Columbia, and the lowest is Saskatchewan.
Comparing bovine fees is not as easy as comparing companion animal fees. With the exception of heartworm, most companion animal procedures are performed in the same fashion and the same number of times from province to province. Differences between dairy and beef production, however, can create vast differences in large animal practice fees across the country. Veterinarians in provinces that are predominantly dairy (Prince Edward Island, Ontario, and British Columbia) use hourly rates more than provinces with a beef predominance, where fees are normally charged by the procedure. The weighting procedure used for the Bovine Fee Index has incorporated both pricing systems.
Analysis of bovine fees yielded 2 very disturbing findings. Ironically, the dairy provinces, where veterinarians rely mostly on hourly rates, had the lowest hourly rates. The highest dairy province hourly rate was in Ontario at only $0.18 above the national average.
Differences in the cost of living were not used with bovine and equine fees, because farm input costs are considered more homogeneous than household spending.
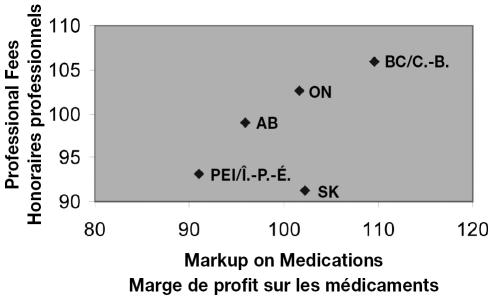
The 2nd disturbing finding was the relationship between bovine professional fees and markups. The highest markups on medications were found in British Columbia, where the average markup (indexed) was 9% higher than the national average. Veterinarians in British Columbia also had the highest fees at 6% above the national average. With the exception of Saskatchewan, most provinces exhibited an alarming tendency to charge lower fees alongside lower markups on medications (Figure 1). Economically speaking, there should be an inverse relationship between markups on medications and professional fees. As markups on medications lower, the amount spent by the producer decreases, thereby freeing up more to be spent on professional fees. Clearly, that is not happening. Why?
Figure 1.
Markup on medications and professional fees./Marge de profit sur les médicaments et honoraires professionnels.
Many mixed animal practices in Canada are still reeling from bovine spongiform encephalopathy (BSE) and pricing is still not yet back to pre-BSE levels. The chart showing the alarming relationship between professional fees and markups suggests that some provinces have a long way to go.
Echoing the findings in bovine fees, equine fees and markups on medications were highest in British Columbia. Since many veterinarians in provinces such as Prince Edward Island and Saskatchewan practice equine medicine from a mixed animal practice, it is not surprising that the hourly rate is similar for both species.
So is Saskatchewan the envy of companion animal veterinarians? Hardly. Most veterinarians know they have to increase their fees every year to keep up with inflation. Some have done better than others, and some have had an easier ride, due to weaker provincial inflation. Veterinarians in British Columbia have done the best job of protecting their fees post BSE, but what effect has that had on net incomes? How do incomes compare around the provinces? Stay tuned, the CVMA Business Management Program will answer this and other management questions in this new series that compares the results of the economic surveys from province to province.
Footnotes
This article is provided as part of the CVMA Business Management Program, which is co-sponsored by Hill’s Pet Nutrition Canada Inc., Petplan Insurance, Schering-Plough Animal Health, and Scotiabank.
Reference
- 1.Statistics Canada, [homepage on the Internet] c2006. Average household expenditures, by province and territory. Available from http://www.40statcan.ca/01/cst01/famil16d.htm Last accessed 29 January 2007.


