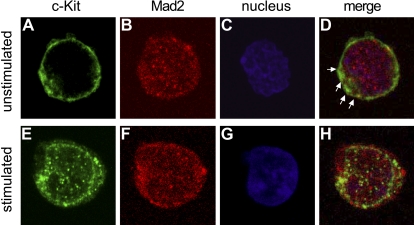
Figure 7.
Mad2 colocalizes with c-Kit in cytoplasm in MO7e cells. Top (A-D) and bottom (E-H) panels show unstimulated and cytokine-stimulated MO7e cells, respectively. Images were acquired by confocal microscopy with an oil immersion lens (magnification, × 100). c-Kit is shown in green (A,E), Mad2 in red (B,F), and nucleus in blue (C,G). Merged images are shown in panels D and H. Arrows indicate representative colocalization of Mad2 with c-Kit.

