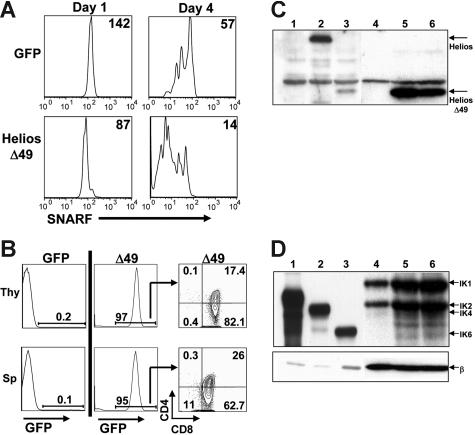
Figure 6.
Enhanced in vitro T-cell proliferation and aggressive T-cell expansion on secondary transfer of Δ49-285-expressing splenocytes. (A) Splenocytes from GFP control or Δ49-285–expressing animals were labeled with the lipophilic dye, SNARF-1, prior to costimulation with anti-CD3 and anti-CD28 treatment. The mean fluorescence intensity (MFI) of SNARF-1 is indicated following 1 and 4 days of culture after in vitro stimulation. All plots shown were first gated on GFP+CD8+ cells. Experiments were done using cells isolated from 3 independent GFP control and 3 nonsick Helios Δ49-285 animals at 4 months after transplantation. (B) Representative FACS analysis of the thymus (Thy) and spleen (Sp) at 4 to 5 weeks after transplantation of 2 × 10⁶ splenocytes from primary GFP control (n = 2) or moribund Δ49-285 mice (n = 2) into 5 nonirradiated, congenic secondary recipient animals per primary animal. (C-D) Western blot analysis of Helios (C) and Ikaros (D) expression in 2 × 10⁶ GFP+ thymocytes purified from 1 GFP control (lane 4) and 2 moribund Δ49-285 Helios animals (lanes 5 and 6). After probing with Helios or Ikaros, blots were stripped and reprobed with a monoclonal antibody to β-actin (β). Lanes 1 to 3 show extracts from BOSC23 cells transfected with retroviral vectors expressing the GFP parent (C: lane 1), full-length Helios (C: lane 2), Helios Δ49-285 (C: lane 3), IK2 (D: lane 1), IK4 (D: lane 2), and IK6 (D: lane 3) as controls.

