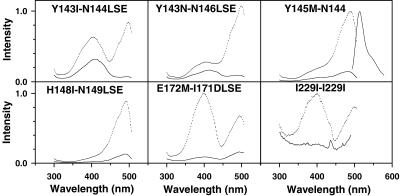
Figure 3.
Excitation spectra of selected circular permutations of EGFP. Dotted lines (upper traces in each panel) are spectra taken at pH 8; solid lines (lower traces) are at pH 6 for the same concentration of protein. Spectra for different mutants were recorded with varying protein concentrations and gains, so amplitudes cannot be compared across permutations. The permutations are denoted by their starting and ending amino acids as in Table 1. An emission spectrum for Y145M–N144 is included in Upper Right; emission spectra for all the circular permutations were essentially identical in shape and wavelength.

