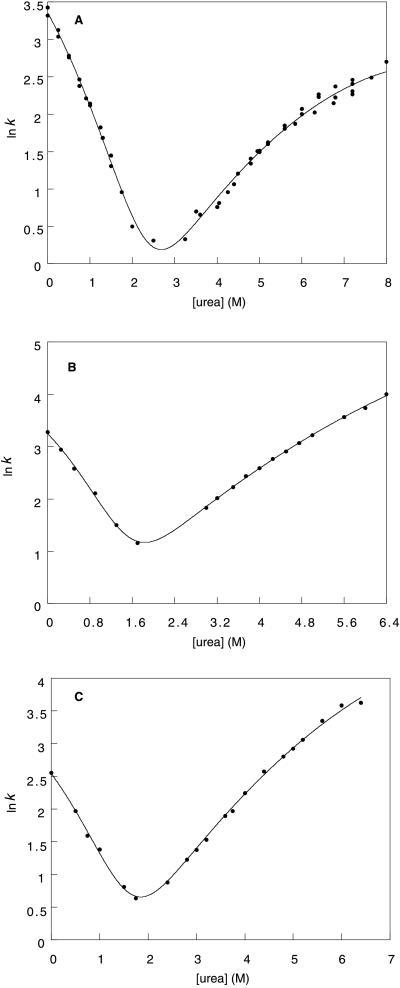
Figure 2.
Kinetics of folding and unfolding of gelsolin domain 2. The curve indicates the best fit of the data to Eq. 5, where y = ln(kobs) and x is the denaturant concentration. (A) Chevron plot for wild-type gelsolin 151–266 at 25°C; (B) chevron plot for D187N mutant gelsolin 151–266 at 25°C; and (C) chevron plot for D187Y mutant gelsolin at 15°C.

