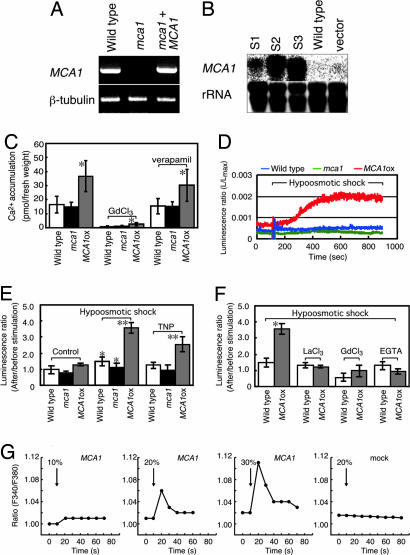
Fig. 3.
Mca1 protein enhances Ca2+ uptake activity in planta. (A) RT-PCR showing no detectable production of MCA1 transcripts in the mca1-null line. β-tubulin is a control. (B) Northern blotting, showing MCA1 mRNA levels in MCA1ox (S1, S2, and S3), wild-type, and vector-bearing wild-type lines. rRNA was used for control experiments. (C) Overexpression of Mca1 increases Ca2+ uptake in intact roots. The roots were incubated with 45CaCl2 for 20 min and washed five times with a washing solution containing LaCl3, which displaces 45Ca2+ nonspecifically bound to the cell wall (33). The uptake is inhibited by 1 mM Gd3+, but not by 20 μM verapamil. ∗, P < 0.01 versus wild type. (D) Hypoosmotic shock-induced [Ca2+]cyt changes, as revealed in aequorin luminescence. Wild-type, mca1-null, and MCA1ox seedlings with aequorin in MS medium (400 μl) were subjected to hypoosmotic shock with the addition of H2O (200 μl). Representative data are shown for each seedling. (E) Summary of hypoosmotic shock- and TNP-induced [Ca2+]cyt changes. As for hypoosmotic shock, experimental conditions were the same as those in D. For TNP stimulation and control experiments, 0.3 mM TNP (200 μl) and MS medium (200 μl) were added to the seedlings in MS medium (400 μl), respectively. The average of five independent experiments is shown for each sample. ∗, P < 0.05 versus each control; ∗∗, P < 0.005 versus wild type in each treatment. (F) Effect of channel blockers and a Ca2+ chelator on the hypoosmotic shock-induced [Ca2+]cyt increase. Ten minutes before hypoosmotic shock, 1 mM La3+, 1 mM Gd3+, or 5 mM EGTA (calcium chelator) was added to the medium. ∗, P < 0.005 versus wild-type and reagent-treated samples. (G) Stretch-activated Ca2+ response in MCA1-expressing and mock-transfected CHO cells. Cells cultured on elastic silicone membranes were loaded with 1 μM fura-2/AM and subjected to a uniaxial stretch pulse (10, 20, or 30% of the length for 1 s at room temperature). Fura-2 fluorescence intensities at excitation wavelengths of 340 and 380 nm were acquired and the ratio (F340/F380) was calculated. An increase in the ratio donates a [Ca2+]cyt increase. (Right) Mock-transfected cells. (Center and Left) MCA1-expressing cells.

