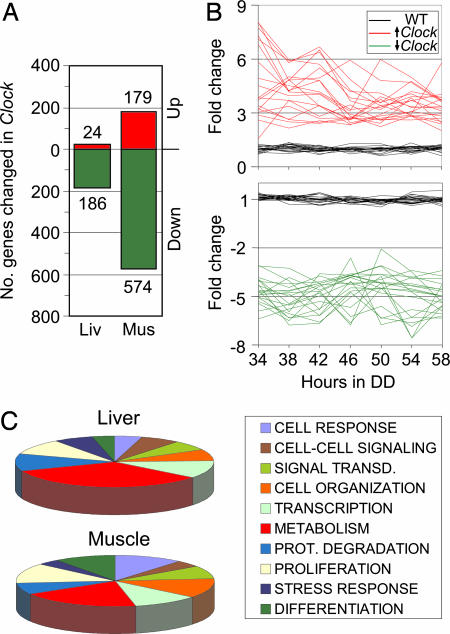
Fig. 3.
Effect of the Clock mutation on gene expression. Gene expression in liver and gastrocnemius muscle from Clock mice was compared with gene expression in WT mice. (A) Bar graphs represent the number of genes whose average expression over a 24-h period showed significant, >2-fold change in expression in Clock tissue. In both liver and muscle, the majority of CLOCK-controlled genes were down-regulated compared with WT expression. (B) Each graph shows 20 examples of genes whose average expression was up-regulated (Upper) or down-regulated (Lower) in Clock muscle. (C) Pie charts depict the most highly represented functional categories of genes changed in Clock mouse liver or muscle.

