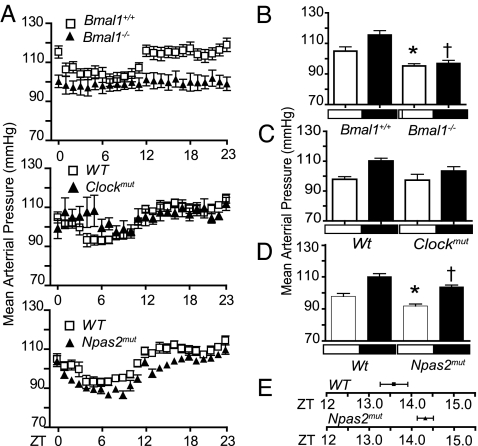
Fig. 1.
BMAL1 and CLOCK and NPAS2 differ in severity of BP variation and maintenance according to the severity of the genotype. (A) MAP telemetry recordings averaged each hour from three 24-h periods in WT, Bmal1−/−, Clockmut, and Npas2mut mice. MAP recordings were significantly different (Kruskal–Wallis test) for Bmal1−/− (light phase, P < 0.05; dark phase, P < 0.0001) and Npas2mut mice (both light and dark phase. P < 0.0001). Clockmut mice were significantly different only during the light phase (P < 0.05). MAP recordings taken separately during light and dark phases in Bmal1+/+ vs. Bmal1−/− (B) (n = 8; ∗, P < 0.05; †, P < 0.001), WT vs. Clockmut (C) (n = 4–8) WT vs. Npas2mut mice (D) (n = 8; ∗, P < 0.05), and delayed acrophase (time of peak) of MAP rhythm in Npas2mut vs. WT (D) (n = 8, P < 0.05). White boxes denote lights on, and dark boxes denote lights off.

