
Figure 7.
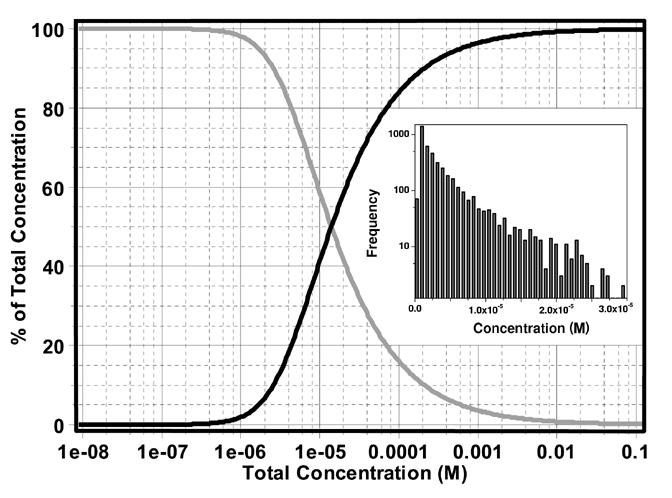
Distribution of monomer (grey line) and trimer (black line) concentration vs. total concentration of recombinant bovine factor B. As shown in this plot, the dissociation constant is well described by the range of the measured concentrations. Therefore, the data provide signal for both the monomeric and trimeric factor B species. The inset shows the relative frequencies of data points for each concentration.