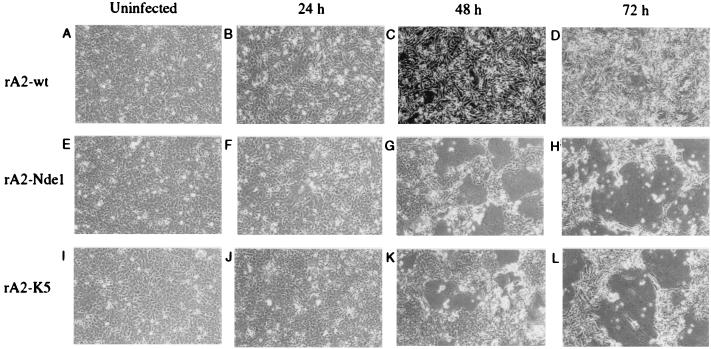
Figure 3.
Cytopathogenicity of the rA2-NdeI and rA2-K5 viruses compared with rA2-wt. HEp-2 cells were mock infected or infected at an moi of 1 with the indicated virus, incubated for the indicated time, and photographed (×10). The 48-hr micrographs are darker because of a difference in exposure. Large syncytia are obvious in the two mutant viruses at 48 and 72 hr, and smaller ones are evident at 24 hr and in rA2-wt infected cells at the same three time points.

