
Fig. 3.
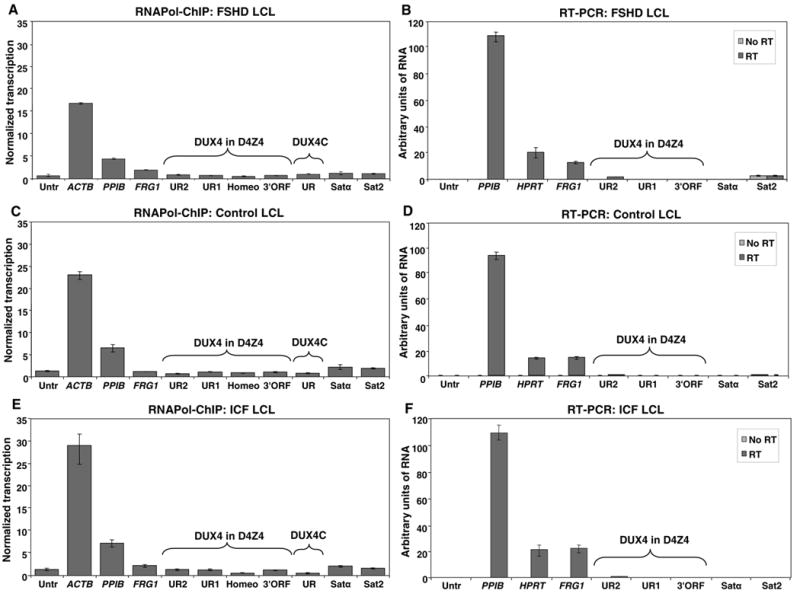
Transcriptional analysis of D4Z4 and satellite DNA sequences in FSHD, ICF, and control lymphoblastoid cell lines. (A), (C), and (E), an FSHD LCL (GM17939), a control LCL (AG14836), and an ICF LCL (GM08714), respectively, were used for ChIP with an antibody specific for RNA Pol II (H-224). Immunoprecipitated DNA was analyzed by qPCR with the indicated primers, as for Fig. 2. (B), (D), and (F), RNA from the same ICF and control LCLs and a different FSHD LCL (GM17868) were analyzed by qPCR with or without reverse transcription. The normalized transcription levels for Panel A for Untr, FRG1, UR1, UR2, Homeo, 3′ORF, UR, Satα, and Sat2 were as follows: 0.7, 1.97, 0.74, 0.91, 0.62, 0.74, 1.05, 1.27, 1.13. For panel B the respective values were: 1.35, 1.19, 1.12, 0.71, 0.92, 1.03, 0.8, 2.1, 1.94. For panel C the respective values were: 1.41, 2.23, 1.27, 1.38, 0.54, 1.19, 0.48, 2.03, 1.53. VASSILI, THE BAR FOR UR2 LOOKS QUITE A BIT HIGHER THAN FOR UNTR BUT UR2’S VALUE IS ONLY ~3% HIGHER THAN UR1’S. ALSO PLEASE CHECK THE REST OF THE BARS VS. VALUES FOR HIS FIG.