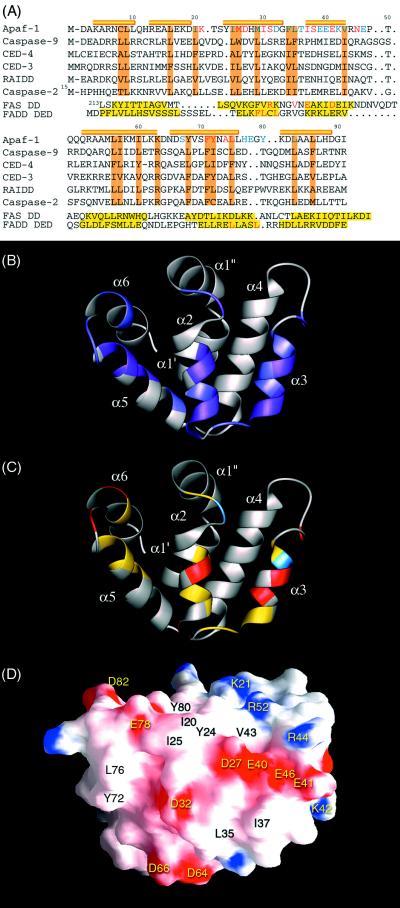
Figure 2.
Apaf-1 CARD binding surface is centered around α2 and α3. (A) Sequence alignment of the CARD members, Fas DD, and FADD DED. The α-helices identified in Apaf-1 CARD are represented by cylinders on top of the sequence alignment. Conserved hydrophobic residues are colored in brown. The chemically perturbed residues of Apaf-1 CARD observed during NMR titration experiments are divided into two groups. The residues showing severely broadened resonance during the titration are colored in red, whereas residues with shifted resonance are colored in blue. For Fas DD and FADD DED (20, 22), the helical regions are colored in yellow. In FAS DD, point mutations that disrupt the DD/DD homophilic interaction are colored in red. The proposed hydrophobic residues involved in FADD DED binding are also colored in red. (B) Ribbon diagram of Apaf-1 CARD highlighting the residues whose local chemical environments are perturbed during caspase-9 CARD binding. Residues ofwhich NH resonance are severely broadened are colored in purple. Residues with shifted NH resonance are colored in light purple. (C) Ribbon diagram the same as in B. Here the chemically perturbed residues with hydrophobic, acidic, and basic sidechains are colored in yellow, red, and blue, respectively. (D) Surface diagram of Apaf-1 CARD in the same orientation as in B and C. In this figure, the surface electrostatic potential is color coded such that regions with electrostatic potentials <−8 kBT are red, whereas those >+8 kBT are blue (where kB and T are the Boltzmann constant and temperature, respectively). Surface-exposed hydrophobic residues are labeled in black.

