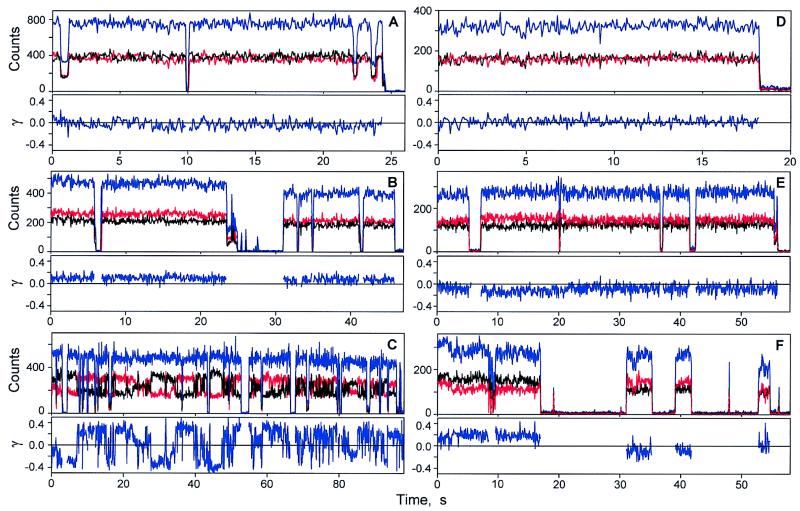
Figure 3.
The fluorescence trajectories of single LH2 complexes detected with the excitation polarization switching between 0 and π/2. λex is 794 nm in A–C. (A) LH2 assembly with similar Ix and Iy trajectories. (B) LH2 exhibiting different Ix and Iy signals. (C) LH2 undergoing polarization changes on the subsecond and seconds time scales. λex is 850 nm in D–F. (D) LH2 with similar Ix and Iy trajectories. (E and F) LH2 complexes exhibiting fluctuations in the Ix and Iy signals resulting in changes of γ. Black, Ix; red, Iy; blue, the total fluorescence signal.

