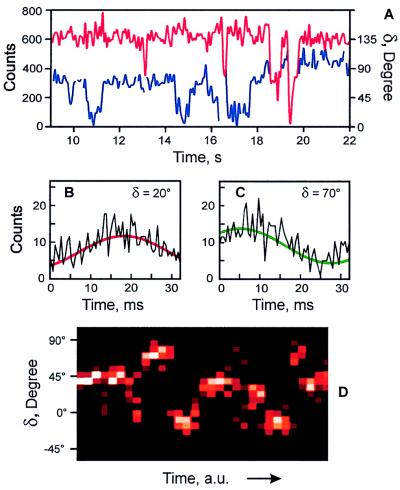
Figure 6.
The dynamics of a typical LH2 assembly. (A) A portion of the δ (blue) and count rate (red) trajectories of the LH2 complex shown in Fig. 5C. (B and C) The two segments of the detected fluorescence trajectory and their fits by Eq. 3 resulting in the δ values of 20° (B) and 70° (C). (D) The time-resolved probability histogram of the phase. The number of occurrences varies from 0 (black) to 15 (white).

