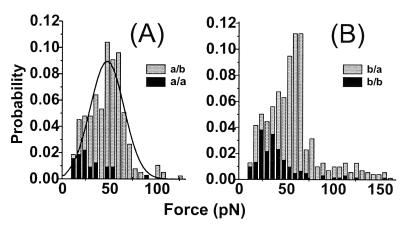
Figure 2.
The probability distribution of the unbinding forces of the last rupture events for ≈500 approach/retract cycles for a retract velocity of 100 nm/s. (A) The histograms show the specific a-tip/b-surface interaction (gray) and the unspecific a-tip/a-surface interaction (black). (B) Histograms of the b-tip versus a- (gray) and b-surface (black) unbinding force distribution. This tip shows an increase in multiple unbinding forces and unspecific binding. The comparison of all four tip/surface combinations demonstrates the specificity of the unbinding force experiment. In both histograms, the most probable unbinding force is ≈50 pN. The maximum of the distribution is found by a Gaussian fit to be, for example, 48 ± 2 pN in A.

