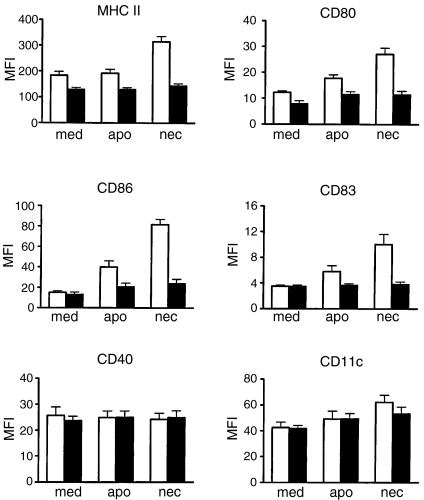
Figure 2.
Comparison of surface marker expression of cord and adult dendritic cells (DCs) 36 hr after exposure to culture medium control (med), early apoptotic (apo) or necrotic (nec) LCLs. The expression of DC phenotypic and functional markers (as indicated) was analysed by flow cytometry. Isotype controls were either mouse immunoglobulin G1 or immunoglobulin G2a and the mean fluorescence intensity (MFI) for the isotype controls was within the first decade and did not change significantly with the different DC treatment. The data are presented as MFI ± SEM of six independent experiments. Cord DCs, solid bars; adult DCs, open bars.

