Figure 1.
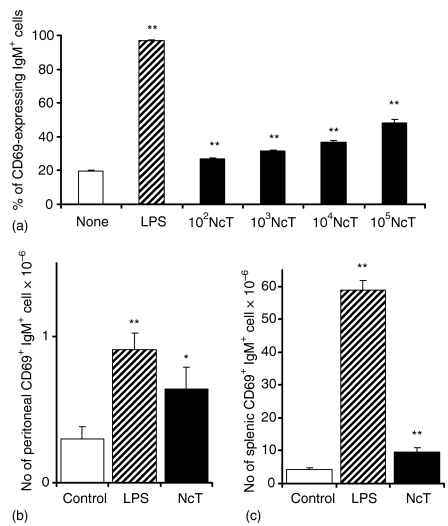
Early B-cell activation induced in vitro and in vivo by N. caninum. (a) Expression of CD69 on the surface of BALB/c mice splenic IgM+ cells as evaluated by flow cytometric analysis 14 hr after in vitro stimulation with medium alone (None), with 5 µg/ml of LPS (LPS) as a positive control or with 102−105N. caninum tachyzoites/ml (NcT) as indicated. Bars represent means plus 1 SD of triplicated well samples for each indicated group. This is one representative result of three independent experiments. (b and c) Numbers of BALB/c mice peritoneal (b) or splenic (c) CD69+ IgM+ cells, 14 hr after i.p. treatment with PBS (Control), 12·5 µg of LPS (LPS) or 5 × 10⁵ NcT. Bars represent the mean plus one SD of three mice per control groups and four mice per N. caninum-treated groups. This is one representative result of three independent experiments. In this and in the following figures statistically significant differences between control and N. caninum-stimulated groups were indicated (*P < 0·05; **P < 0·01).

