Figure 3.
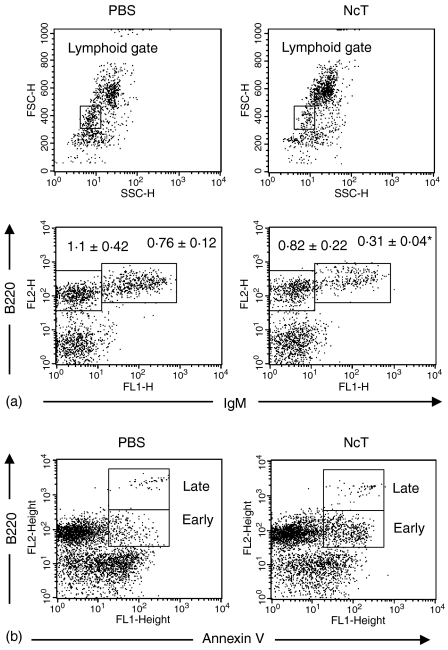
Effect of N. caninum challenge on B-cell maturation in the bone-marrow. Quantification of B-cell precursors (a) in the bone marrow of BALB/c mice 3 days after injection i.p. with PBS or with 5 × 10⁵N. caninum tachyzoites (NcT). Figures shown in the lower dot-plots above the respective regions represent numbers in millions of B220+ IgM– and B220+ IgM+ bone-marrow cells displaying lymphoid forward and side scatter parameters (gated as shown in the upper dot-plots) observed in PBS- or NcT-infected mice as indicated. Numbers represent the mean ± one SD of three mice in the control group and four mice on the N. caninum-infected group. This is one representative result of three independent experiments. Quantification of apoptotic B-lineage (B220+) cells (b) gated as described above, observed in the bone marrow of BALB/c mice 24 hr after PBS- or NcT-inoculation as indicated. Regions on the figure identify early apoptotic (annexin V+) B220+ cells (Early) and late apoptotic/necrotic (propidium iodide+) cells (Late). Represented is one typical result from each mice group of an experiment repeated three times. The mean numbers ± 1 SD of early apoptotic cells were of 92 × 103 ± 3·5 × 103 and 234 × 103 ± 76 × 103 for PBS- or NcT-inoculated mice, respectively (n = 4 on each group, P < 0·05). No significant difference in the numbers of late apoptotic/necrotic cells between these two mice groups was observed.

