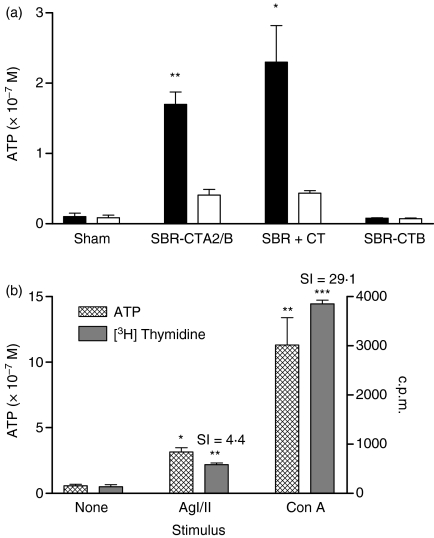
Figure 3.
In vitro responses of splenic cells isolated from groups (n = 4) intragastrically (i.g.) immunized with a genetically coupled protein composed of the saliva-binding region (SBR) of the Streptococcus mutans surface antigen AgI/II and the non-toxic A2 and B subunits of cholera toxin (CT) (SBR-CTA2/B), recombinant SBR admixed with CT (SBR-CTA2/B + CT), SBR chemically coupled to the recombinant CT B subunit (SBR-CTB) or sham-immunized controls. Cell responses were quantified by assay of ATP produced in metabolically active cells cultured with surface antigen AgI/II (solid bars) or culture medium alone (open bars). *P < 0·05 and ***P < 0·001 relative to unstimulated cultures.(b)Comparison of ATP and [3H] thymidine uptake assays for measuring T-cell responses to stimulus. Responses of spleen cells to AgI/II and concanavalin A (Con A) were evaluated by ATP production (hatched bars) and [3H] thymidine uptake (solid bars). *P < 0·05 and **P < 0·01 relative to unstimulated cultures. SI, stimulation index.

