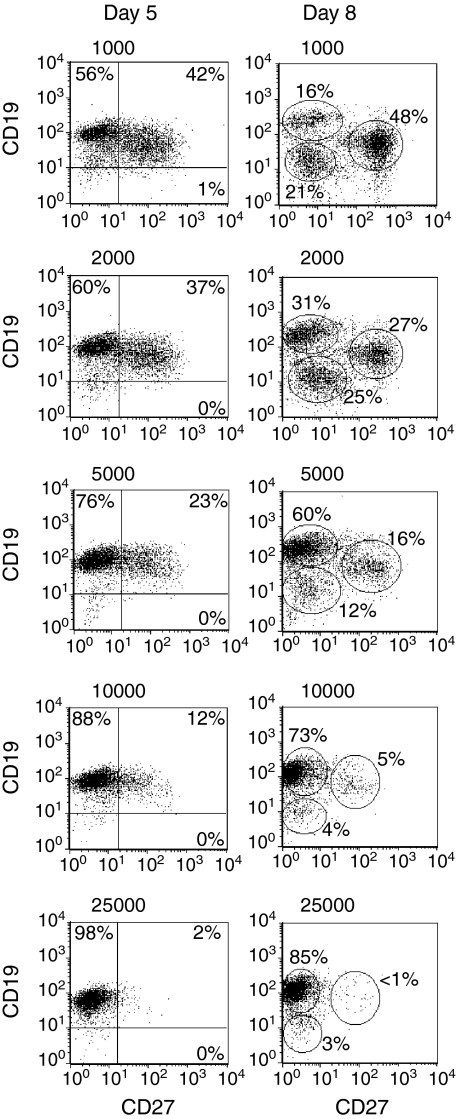
Figure 3.
The number of CD154 molecules per B lymphocyte influenced the evolution of CD19+ CD27– and CD19+ CD27+ populations. CD19-purified B lymphocytes were stimulated in the presence of cytokines, and irradiated L4.5low or L4.5high cells were adjusted to obtain 1000, 2000, 5000 (L4.5low), 10 000 and 25 000 (L4.5high) CD154 molecules per B lymphocyte. In all cases, the number of B cells varied from 2 to 10 per L4.5 cell (L4.5high or L4.5low). The expression of CD19 and CD27 was determined on days 5 and 8 as described in Fig. 1. On day 8, ellipsoid regions highlight three distinct populations, namely CD19++ CD27–, CD19low CD27– and CD19+ CD27++. For day 5 data, numbers indicate the percentages of cells in the indicated quadrants, whereas for day 8 data, they refer to the percentages of cells in each region. These results are representative of three independent experiments.

