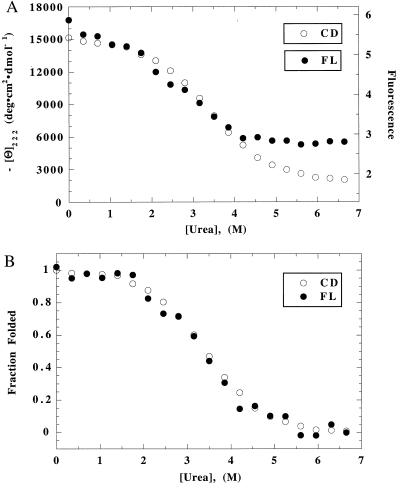
Figure 1.
(A) Unfolding curves of [all-Ala] in 30 mM NaCl/2 mM NaAc, pH 4.2, 20°C, monitored by CD and FL. The scales of the two curves have been linearly adjusted to make them superimpose in the transition zone. (B) Superposition test: the two curves of A have been fitted separately to the two-state equation (20) to determine the baselines; they were normalized by subtracting the baseline contribution. Then the two curves were plotted together to determine whether they are superimposable.

