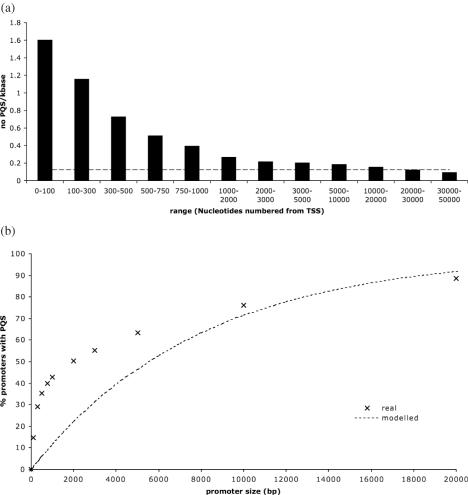
Figure 2.
(a) Density of PQS with distance upstream from the TSS. The genome as a whole has a density of 0.13 PQS/kb, shown by the dashed line. (b) The percentage of promoter regions containing at least one PQS increases as the size of the promoter increases. This increase is extremely fast over the first 1000 bases. The dashed line shows what percentage would be predicted if the density of PQS were equal to that across the genome as a whole.

