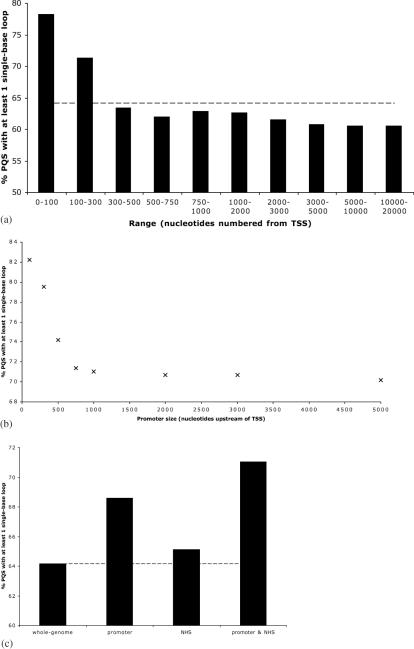
Figure 3.
(a) Percent of PQS identified in given ranges 5′ of a TSS (‘promoter regions’), which have at least one single-base loop. The genome wide average figure is 64% (dashed line). (b) Proportion of PQS upstream of a TSS and within 500 bp of an NHS cluster which have at least one single-base loop decreases rapidly with increasing promoter size. (c) Proportion of PQS with at least one single-base loop in bulk genomic DNA, within 1000 bp upstream of a TSS (promoter), within 500 bp of an NHS cluster, and in promoter/NHS cluster overlap regions. The whole-genome figure is shown as a dashed line.

