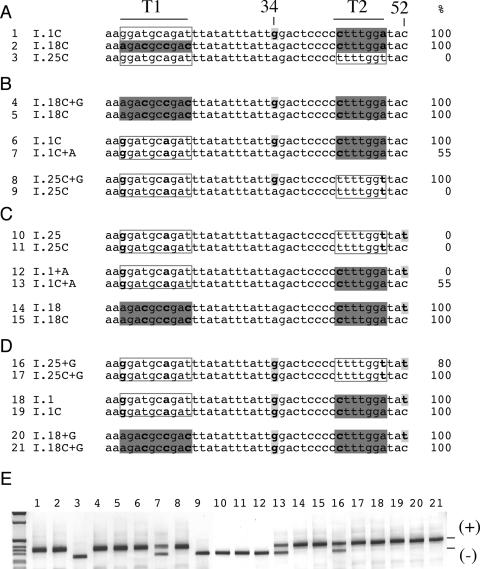
Figure 4.
The context determines the exon splicing efficiency of synonymous substitutions. Significant sequence differences among the minigene constructs are highlighted Percentages of exon inclusion, determined by splicing assay, are indicated on the right. (A) Sequence comparison among I.1C, I.18C and I.25C minigenes. Significant sequence differences among the minigenes are highlighted and correspond to the T1 tract (A13, C16, C19 and C22), to position 34 (G or A) and at the T2 tract (C43 and A49). Compared with I.25C, I.18C had changes at T1 tract sequence (A13, C16, C19 and C22) and T2 tract (C43 and A49) whereas A1C showed differences at G34 and T2 (shown in bold and highlighted). (B) Splicing effect of the G to A substitution in position 34 in the three different contexts derived from I.1C, I.18C and I.25C. The G to A substitution at position 34 did not affect splicing in I.18C (compare I.18C+G with I.18C), caused partial exon skipping in I.1C (compare I.1C with I.1C+A) and complete exon skipping in I.25 (compare I.25C+G with I.25C). (C) Splicing effect of the T to C substitution in position 52 in three different contexts derived from I.1C, I.18C and I.25C. The T to C substitution in position 52 did not affect splicing in I.25 and I.18 context but induce partial exon inclusion in the A1 context. (D) Splicing effect of the T to C substitution in position 52 in three different contexts in the presence of the G to A substitution in position 34. In this case, the T to C substitution in position 52 did not affect splicing in I.1 and I.18 context but induce partial exon inclusion in the I.25 context. (E) RT–PCR products of transfection experiments. The different minigenes were transfected in Hep3B cells and analyzed for splicing efficiency. The exon 12 inclusion and skipping forms are indicated.

